
Throughout the Propellant Insights series, we have examined global markets across multiple geographies, from London to Lima and from Buenos Aires to Brisbane. This week, we continue our world tour, focusing on a market that does not always receive much attention: African Sovereigns.
The African bond market does not get as much press as many others and it may even seem surprising to learn that African bonds are frequently reported via MiFID. However, when looking into the flows, this becomes more logical.
.png)
Chart 1 shows the 2025 volumes for USD- and EUR-denominated African Sovereign issuers, with 16 different countries having active secondary markets in their debt. Egyptian, Nigerian, and South African government bonds have the most active secondary markets, whilst Angolan government bonds also shows a healthy amount of volume. When considering the 2025 GDP of African countries (in USD equivalent), it is not surprising to see South Africa and Egypt in first and second place respectively, with Nigeria coming in 4th and Angola 8th. The only major omission is perhaps Algeria, which typically does not issue debt in USD or EUR.
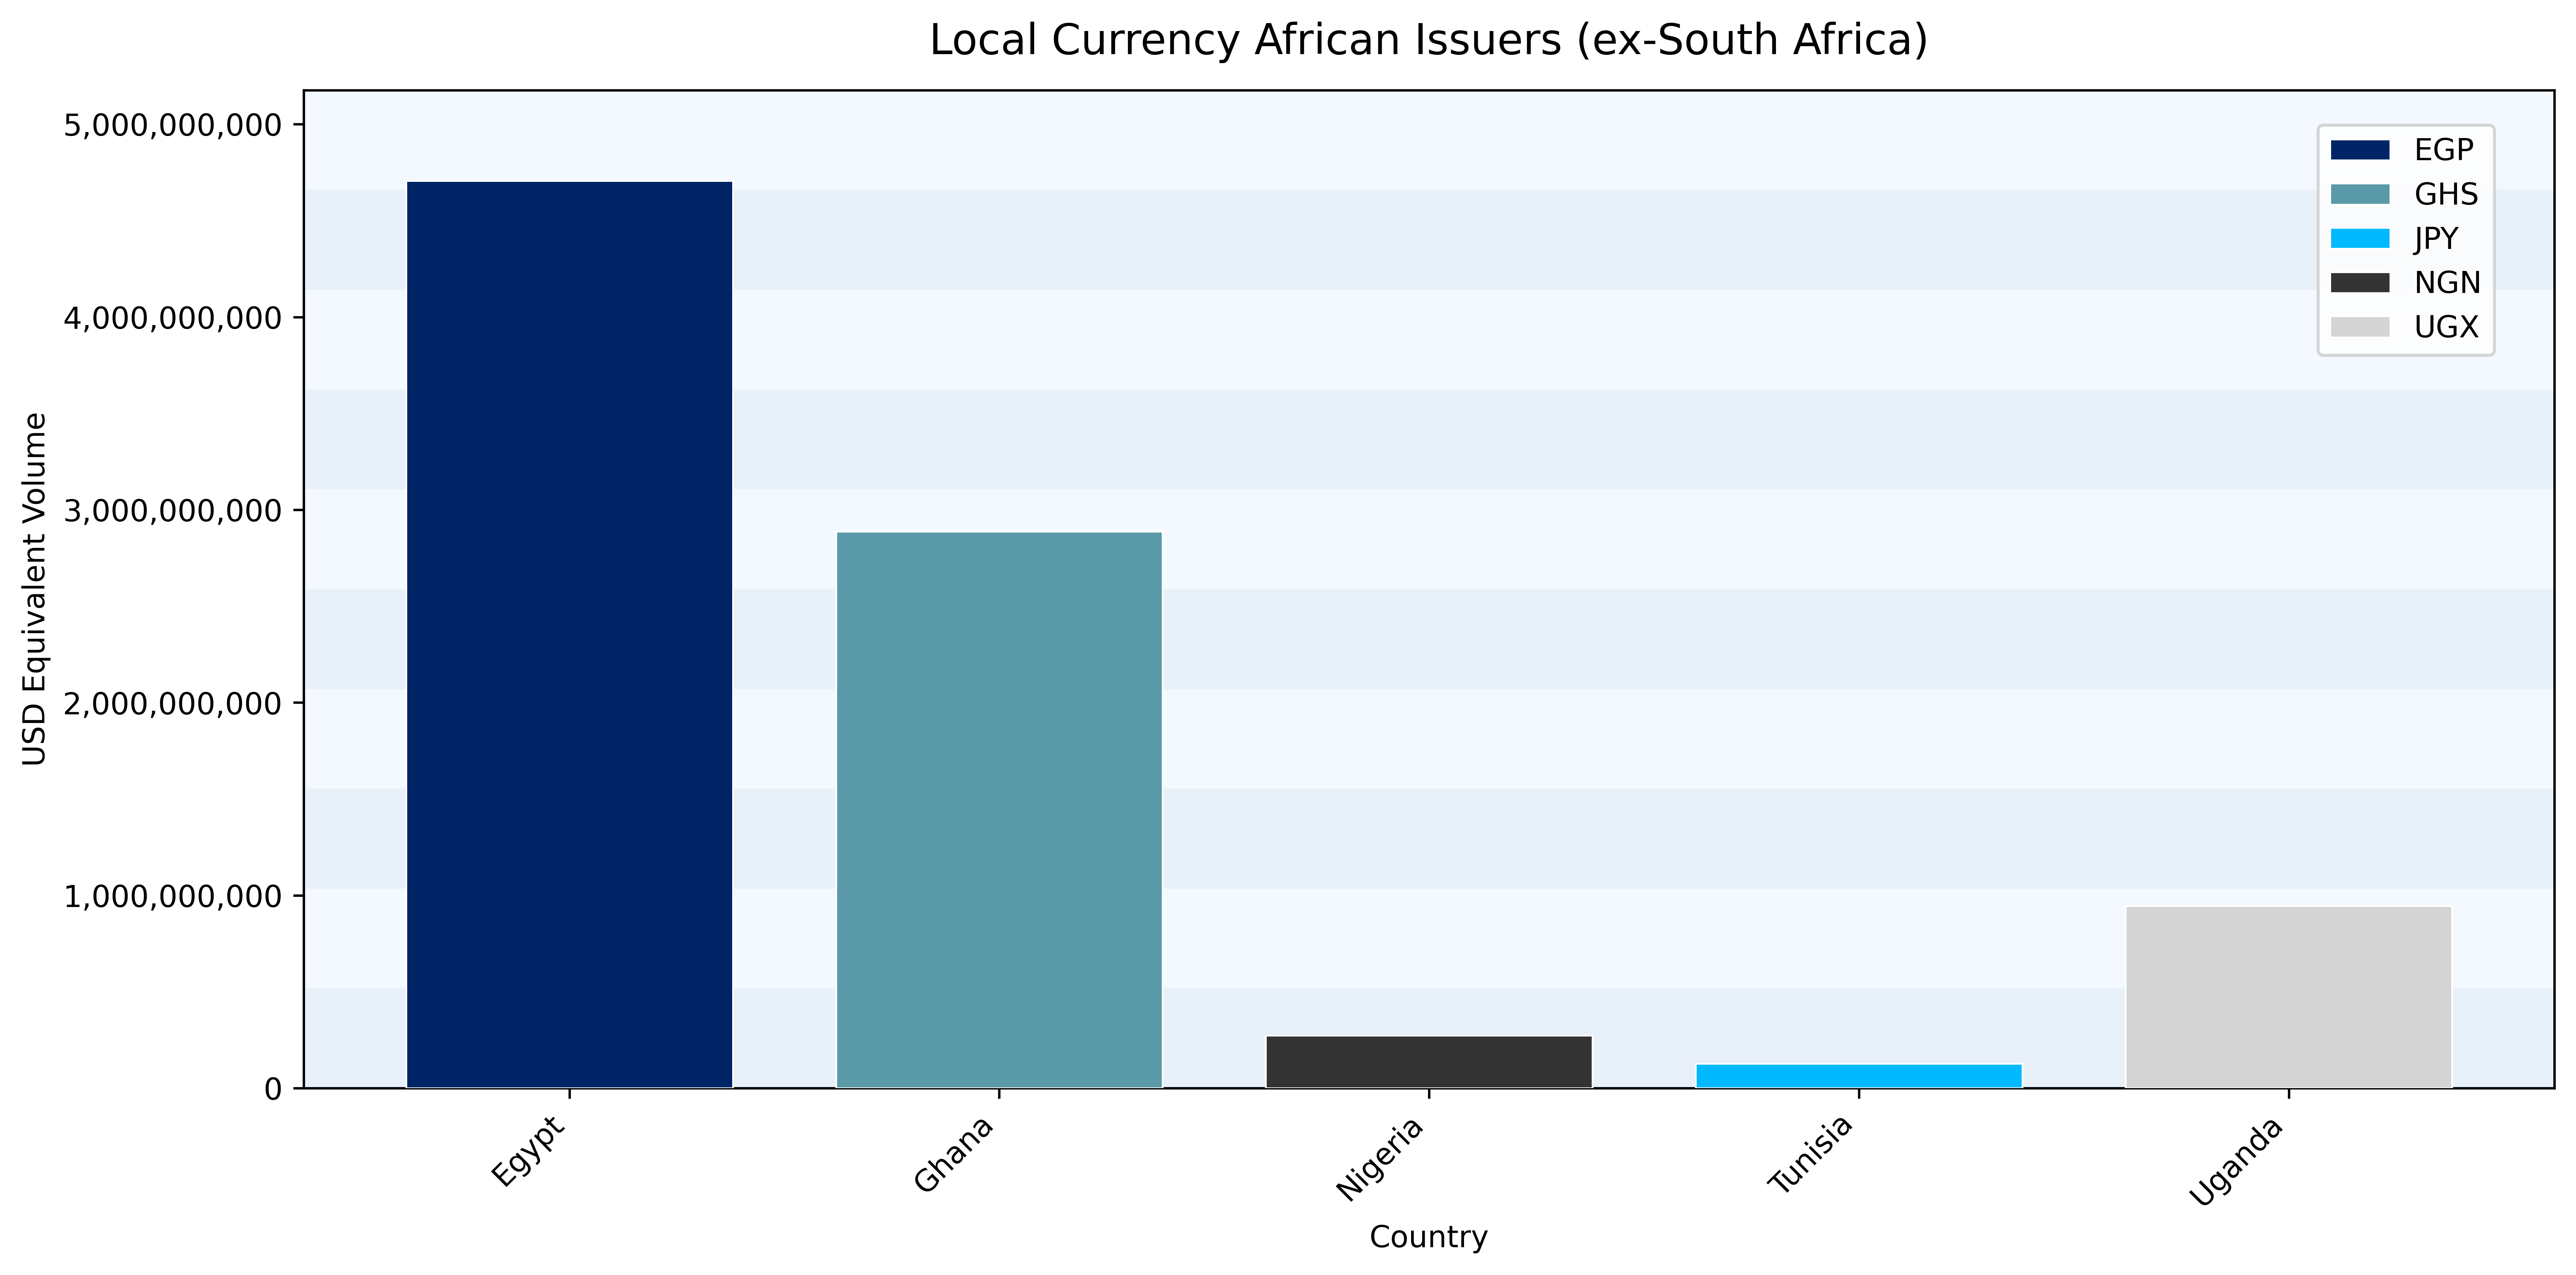
Chart 2 contains one glaring omission, that is of course the country with the largest economy in the region: South Africa.
Given the maturity of the South African bond market, it warrants its own special mention. Whilst many other African nations do have yield curves with multiple issues, the flow reported via MiFID on South African Government Bonds (denominated in South African Rand) was almost 10 times larger than that of its nearest rival, Egypt. Chart 3 below shows the most active bonds on the South African curve throughout 2025.
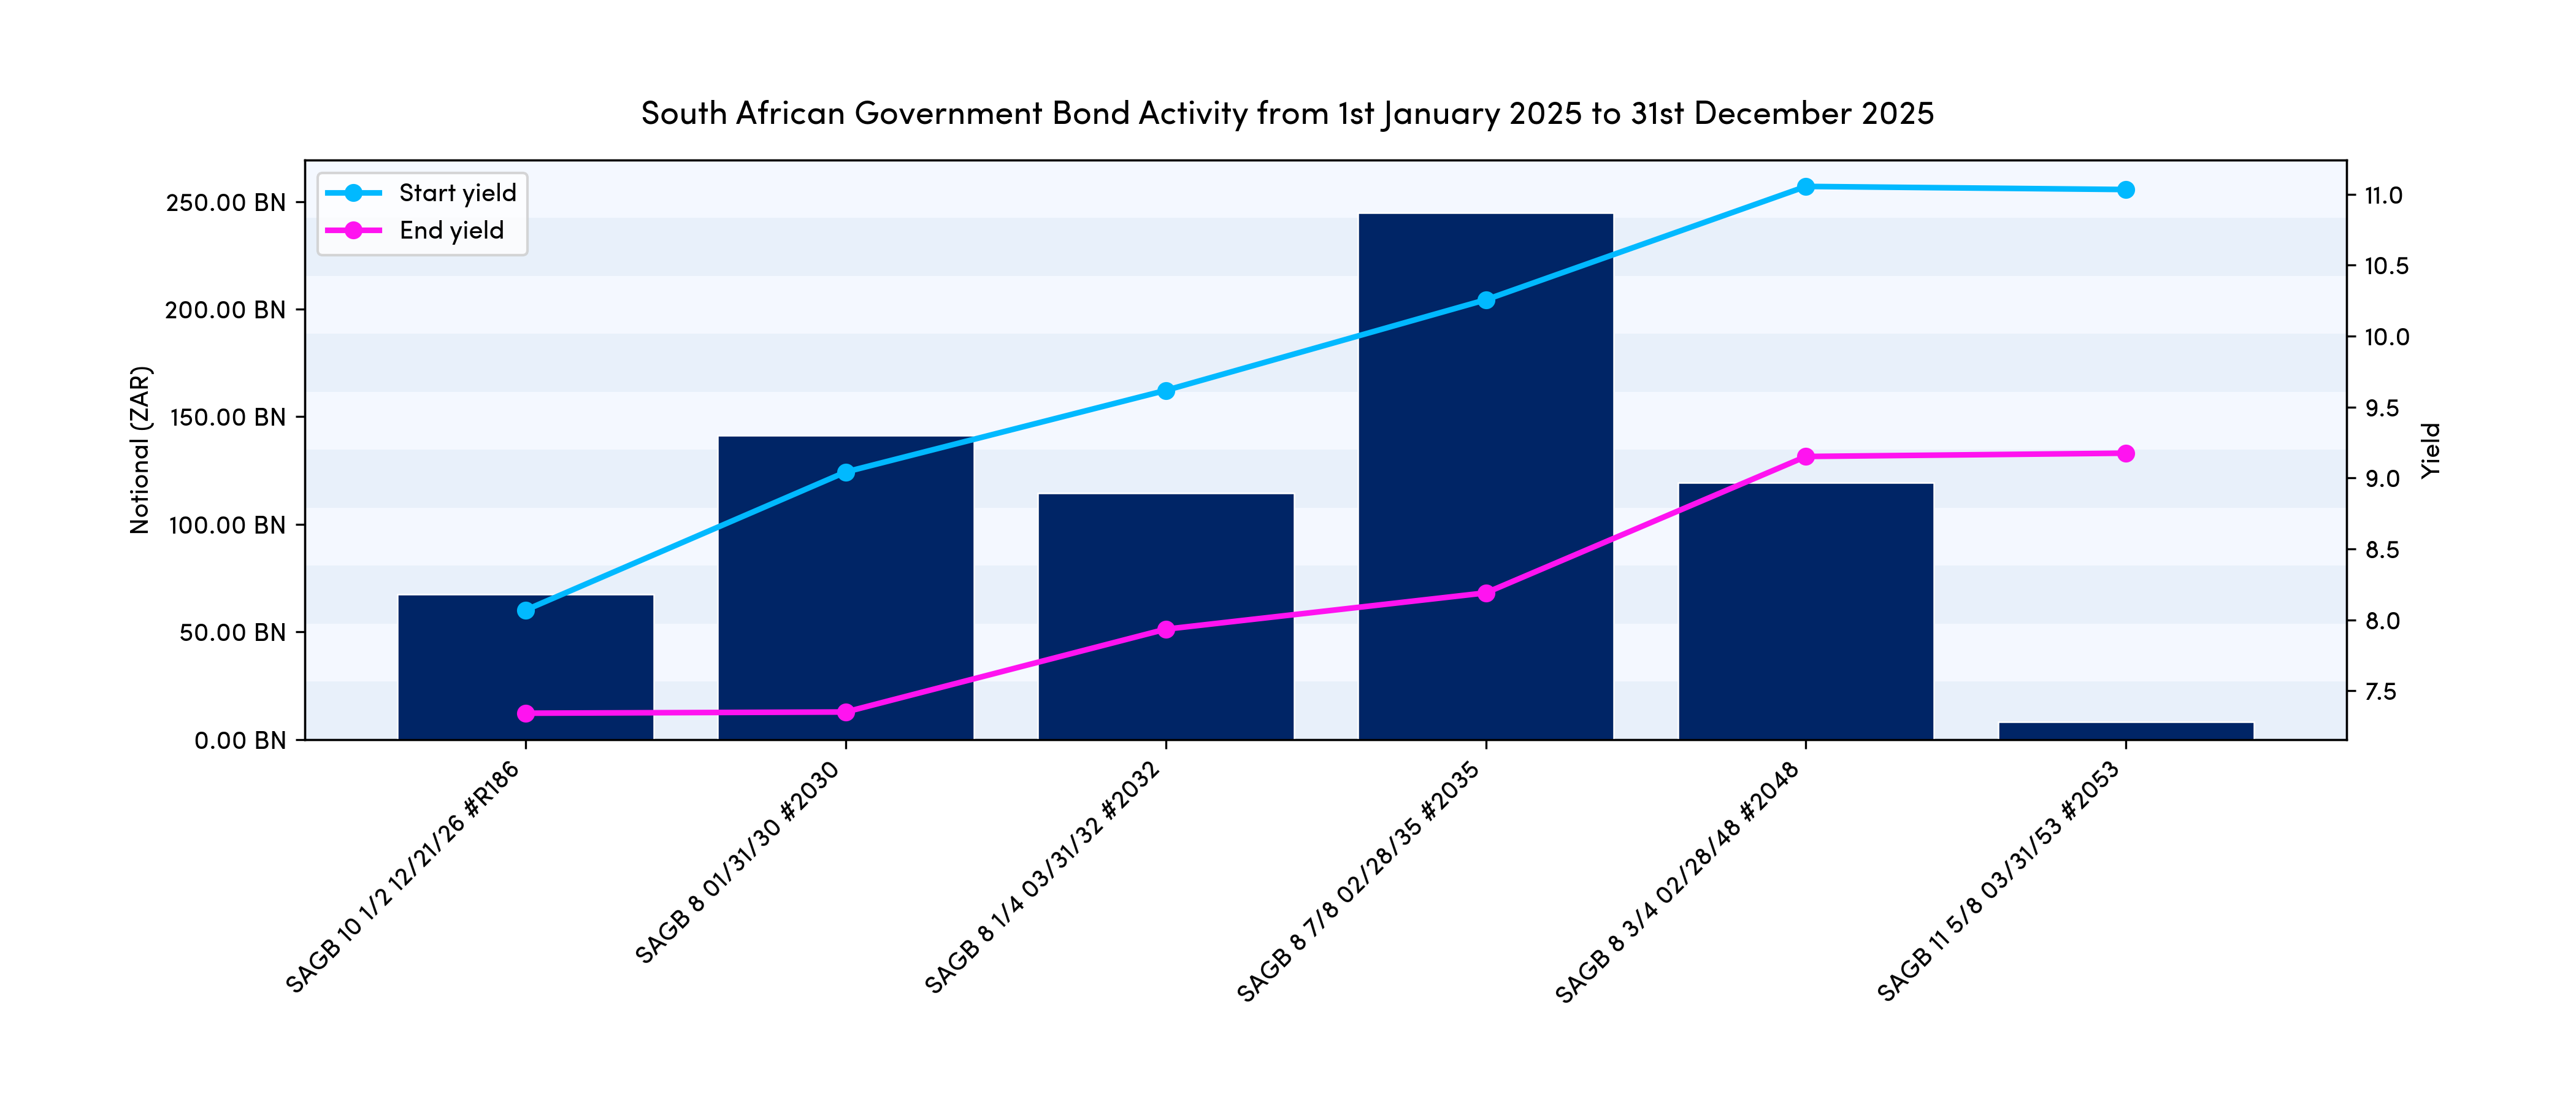
Volumes reported in 2025 across all ZAR (Government issued) bonds exceeded 450 billion, the bulk of which was made up from the issues shown above. For further information about ZAR bonds, swaps, or other African issuers, please reach out to the Propellant team.
2https://www.mfw4a.org/news/first-tunisian-bond-issue-samourai-market